GTA 5 Slope Map
Viewing the slopes of a video game map using a soccer ball1. Retrieving data (in-game)
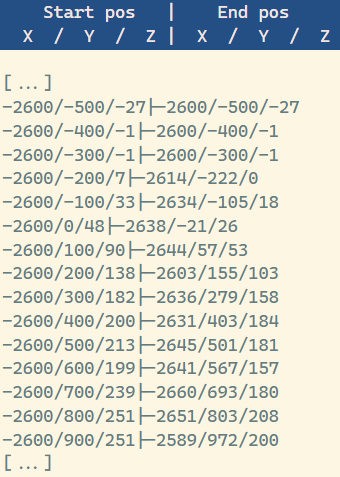
A RAGE Plugin Hook plugin teleports the player to points on a grid (↔100m), then spawns a ball that doesn't collide with the player. As long as the ball hasn't stopped, or the 10-second time limit hasn't been reached: the player is teleported regularly to the ball's position, so that the terrain is properly loaded. Once the time has elapsed or the ball has stopped, we save the start and end coordinates in a file, then move on to the next point 100 m away.
The total size of the grid is 7,500m × 10,900m, the lines are 100 meters apart, so the previous operation was repeated 8,175 times. The maximum time for an operation is 10 seconds, so the total maximum time would be around 22h (in reality it took 12h, the operation takes less than a second when the surface is flat or when you're in the water).
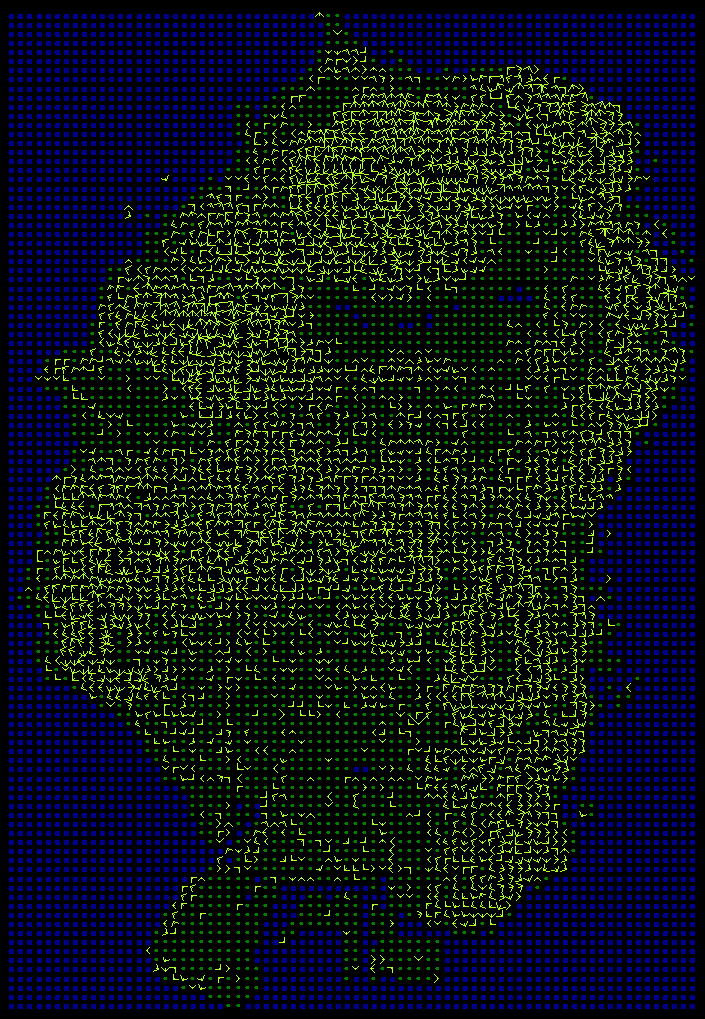
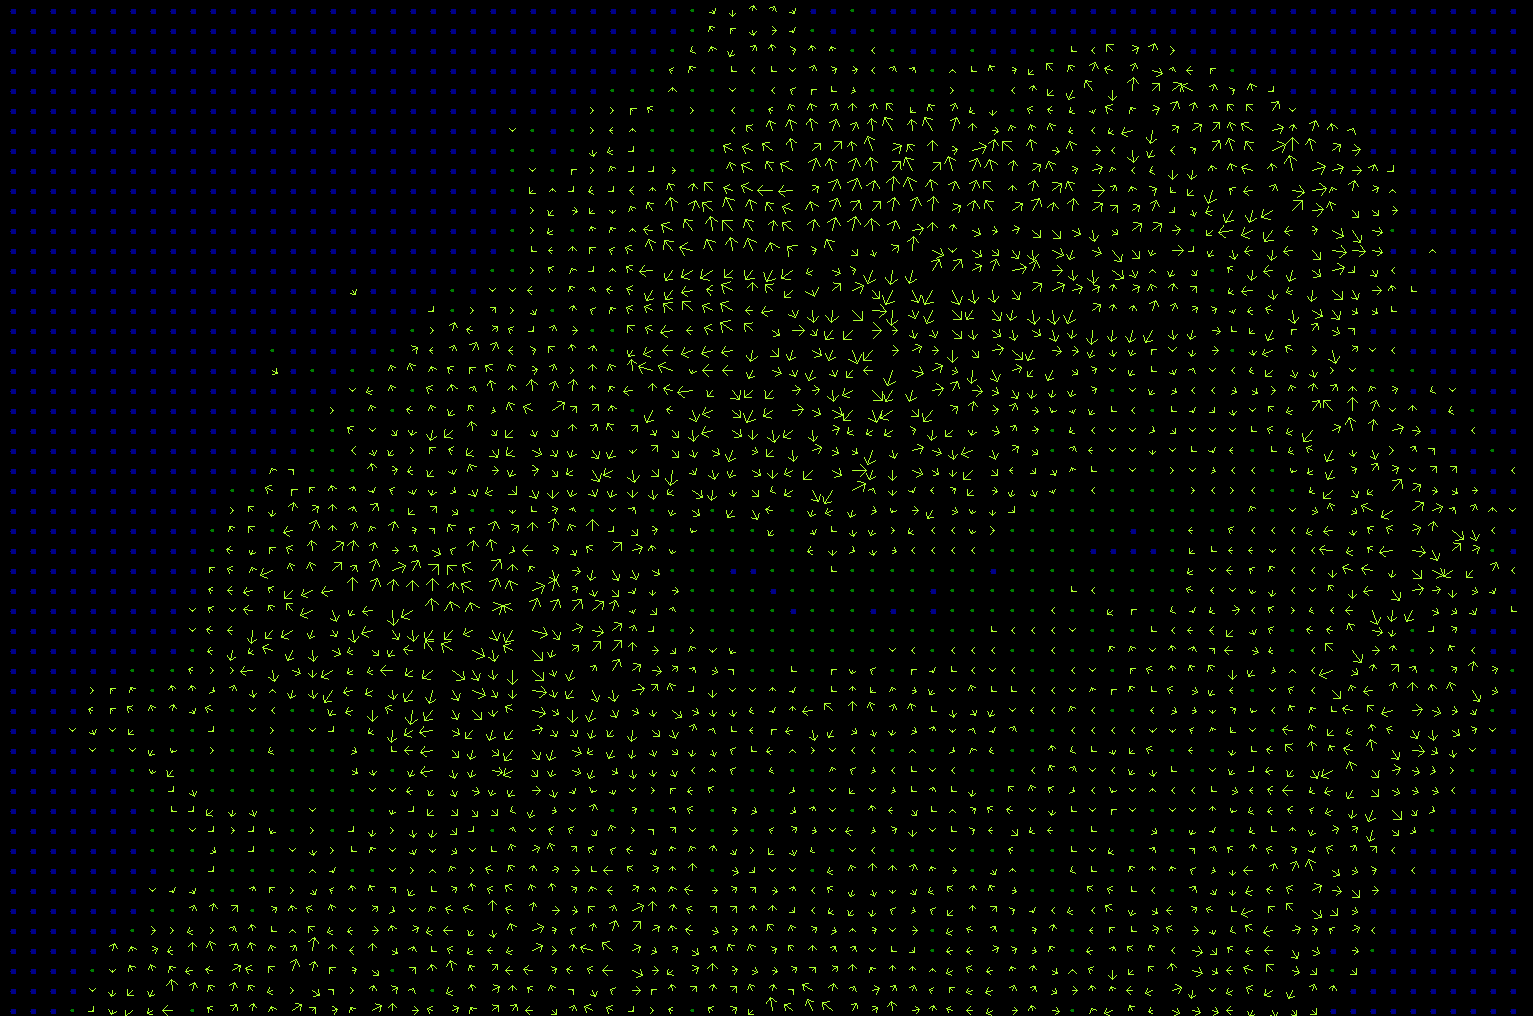
2. Data visualization
To generate an image from this data, I first tried using Python's Turtle module. The rendering worked, but was very slow (1+ min).
I then tried using a WinForm application (with the help of ChatGPT for the base app 🤫). After loading the data contained in the file, I had to extract each value: X start, Y start, Z start and X end, Y end, Z end. The 2 groups of 3 values are added to a list, then the lines are drawn one by one.
The appearance of the lines depends on certain conditions:
if(0 < lenght < 100)
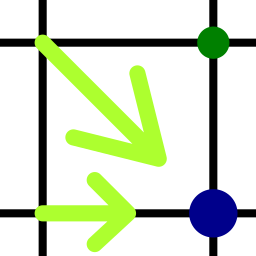
If distance (from start to end) is greater than 0 and less than 100m (ignore incorrect data) → We draw a green line in the direction of the slope, with a larger or smaller arrow depending on the steepness (distance travelled).else if(height < 0 AND height > highestPoint)
Otherwise, if the height component of the coordinate is greater than the highest point on the map (teleport position when ground cannot be found) or less than 0 (under the ocean) → We draw a blue dot (ocean)else if(lenght == 0)
Otherwise, if distance is 0 → We draw a dark green dot (flat ground)else()
Otherwise (errors) → We draw a red line (Not drawn on the examples below)